Using human pluripotent to induce stem cell-derived hepatocytes to form hepatocyte globules
Hepatic toxicity evaluation of 3D models screened in vitro
Target sample is identified and segmented during 3D image analysis to achieve optimal segmentation
Background Introduction:
In developmental biology and tissue biology, 3D cell ball modeling can speed up the process of transformation research, and therefore more and more people pay attention to it. How to perform higher-throughput quantitative analysis of 3D samples has become a hot research topic.
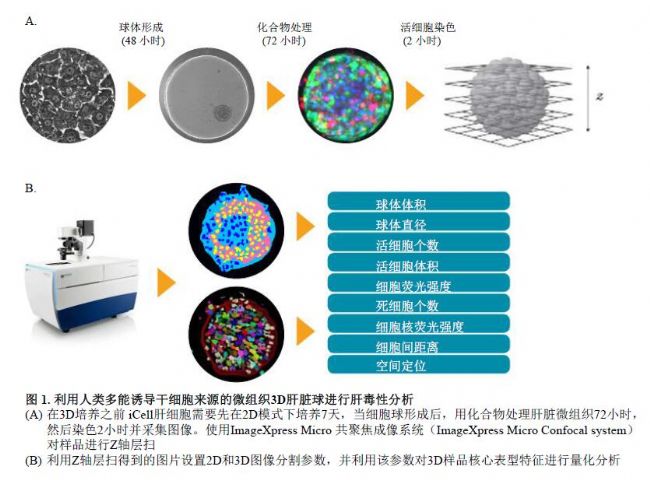
In this example, MD established and optimized an analytical method for confocal imaging and toxicity assessment of human pluripotent stem cell-derived 3D hepatocyte spheres (Figure 1).
Use disposable staining method to evaluate liver toxicity:
Treatment of cell pellets with hepatotoxic test compounds for 72 hours
The cell spheres were stained with three fluorescent dyes dissolved in sterile PBS. The concentrations of the three dyes are:
2 μM calcein AM
3 μM EthD-1
10μM Hoechst 33342 (Life Technologies)
In addition, in order to evaluate the activation of compounds on apoptosis signals and the effects on mitochondrial morphology, the dye concentrations used were:
7.5 μM CellEvent Caspase 3/7
200 nM MitoTracker Orange (Life Technologies)
Hepatocyte ball formation:
The cells used in this example are:
Humans can induce stem cell-derived hepatocytes iCell Hepatocytes 2.0 (Cellular Dynamics International)
HepG2 cells (ATCC)
Operating procedures
The cryopreserved cells are resuscitated according to standard operating procedures;
iCell Hepatocytes 2.0 plating for 2D culture;
The adherent cells were digested with Accutase and mixed with a Geltrex matrix (ThermoFisher Scientific), and the cell mixture was planted at a density of 1000 cells/well in a low-adsorption into a spherical plate (InSphero or Corning);
The wells were centrifuged at 300 g for 2 minutes to precipitate the cells and the bubbles in the matrix were removed, and then the wells were placed in a cell culture incubator and cultured at 37 ° C under 5% CO 2 . Culture of HepG2 cells without the addition of a matrix;
Cell ball formation after 24–48 hours of culture.
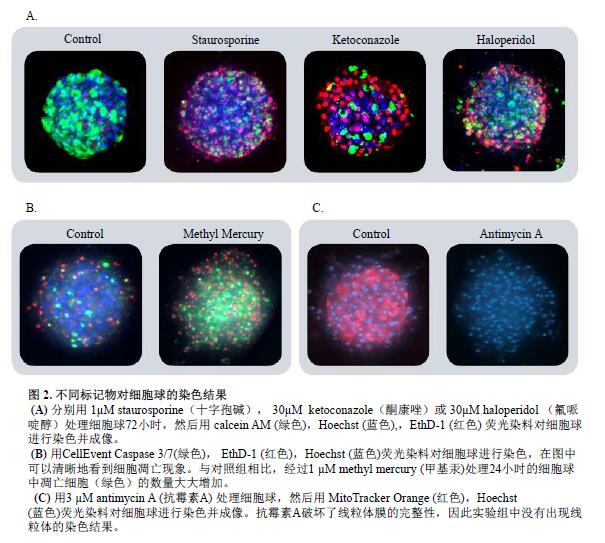
The dye was added to the cell culture system for 2 hours, and then an image was taken. The dye does not need to be eluted, and the loading process is cautious, avoiding damage to the cell ball and causing the cell to disintegrate or deviate from the original position. Typical cell ball staining results are shown in Figure 2.
High-throughput 3D image acquisition and analysis process:
Images were acquired using the ImageXpress® Micro confocal high content imaging system (Molecular Devices) as follows:
Objective type - 10 times mirror and 20 times mirror
Layer sweep spacing -5-10μm
Layer sweep range - 100-120μm
Layer sweep starting position - perforated plate bottom
All results include 2D maximum projection images that can be saved and recalled during the analysis.
Identify and analyze 3D samples
3D images were analyzed using MetaXpress® high-content image acquisition and analysis software. A new 3D analysis module (Figure 3) has been added to the CME User Module Editor, which quantifies the volume, fluorescence intensity, distance and other parameters of the 3D structure and performs batch analysis of the image. The “Find Spherical Objects†function can customize the difference between the morphological parameters (minimum and maximum width, minimum and maximum Z-axis layers) of the target structure and the fluorescence intensity between the target structure and the background, for different sizes. The target structure (small to organelles, large to multiple cell clusters) is defined. For example, set the morphological parameter to:
Nucleus width range -5-15 μm
Number of nuclear layers - 1-2 layers
Fluorescence intensity difference between cell nucleus and background - 200 fluorescence units
Hepatocyte sphere width range - 100-300 μm
Hepatocyte stratification -5-7 layers
Fluorescence intensity difference between hepatocyte sphere and background - 400 fluorescence units
The analysis results include the sphere volume, diameter (or average volume, average diameter) of each target structure, and the total fluorescence intensity and average fluorescence intensity of the spheres in a particular fluorescence channel.
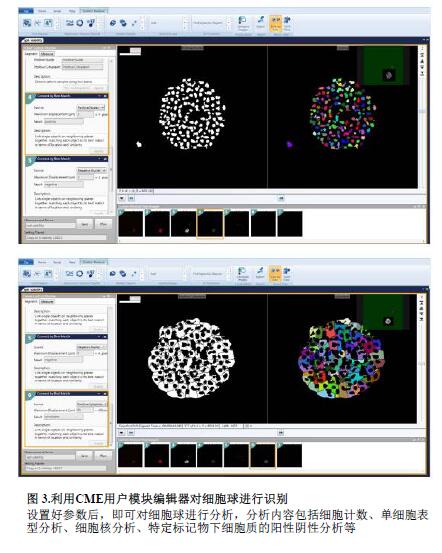
The "Find Spherical Objects" function can also be used to identify individual cells and nuclei or to distinguish different single cells with appropriate features. In addition, the 3D analysis module can connect different levels of target structures according to user-defined options "Connect by BestMatch", "Connect by Touching", and "Do NotConnect Objects".
First, each layer of the Z-axis sweep is segmented according to the 2D image, and the measured values ​​of the number of nuclei, cell death/live and cell classification are obtained. Secondly, the maximum range of the user-defined target structure is used to connect it. stand up. Such as:
The maximum range of cell nuclei is 3-6 μm
Cytoplasmic maximum range 20-30 μm
Finally, the nucleus or single cell is segmented in the 3D structure. The target structure is not lost or counted repeatedly throughout the process. All cells (eg, calceinAM positive/negative cells; Ethidium homodimer positive/negative cells) are identified and counted.
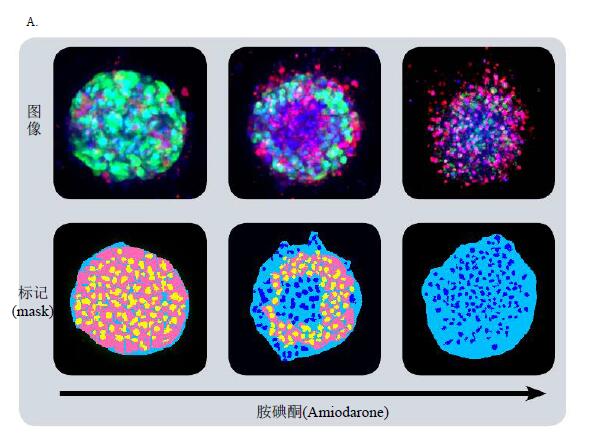
In order to visualize the parameters of the overall/average fluorescence intensity, volume, diameter, spacing of the target structure and the location of the target structure in three dimensions, individual cells can be labeled with different colors. Smaller structures are counted using spheroid masking, which may be in the mask or outside the mask. For example, when analyzing a sample containing only one cell sphere per well, all cells can be counted using single-cell masking and the cells located in the cell sphere and outside the cell sphere can be distinguished. This pattern of processing is important when the cell sphere is incomplete. When analyzing a sample containing multiple cell spheres per well (cell ball and matrix co-culture), this graphical approach defines the volume of each cell sphere and gives an average.
Figure 4A shows the cell sorting results for calceinAM positive cells in 2D images at different levels. Use the “Connect by Best Match†feature to connect cells in 3D space. The same method can be used to analyze ethidium homodimer positive/negative cells (cell dead/live assay). It can also analyze mitochondria, fluorescence intensity, apoptosis and analyze specific dyes and markers.
Multi-parameter phenotypic screening results for toxicity assessment
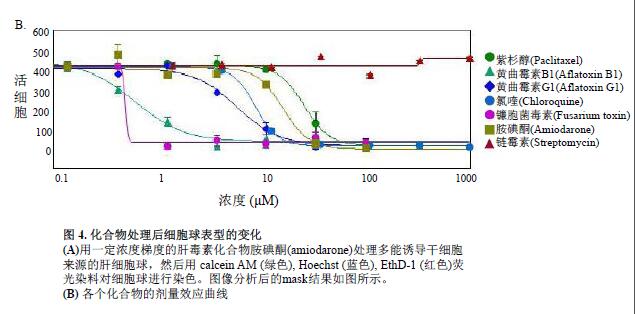
Cellular spheres were treated with various hepatic toxins to observe significant changes in cell phenotype and cell content. Many cell spheres lose their globular structure, the spheres disintegrate, and the cell spheres become loose, flat, and irregular. The cells are detached from the main structure, or condensation nuclei appear, indicating that the cells have died. When the compound concentration exceeds a certain range, the above changes occur in the cell phenotype (Fig. 4B). The parameters obtained from image quantitative analysis were used to evaluate the morphological characteristics, cell content and structural complexity of the cell sphere. The cell volume, diameter, and fluorescence intensity were measured, and the number of calcein AM positive cells (live cells) and EthD-1 positive cells (dead cells) was measured. After the cell spheres were treated with the compound, the total number of cells did not change, the number of dead cells increased, and the number of viable cells decreased (concentration-dependent characteristics); the average fluorescence intensity of calcein AM in the cell sphere and single cell (cytoplasm) was significantly reduced.
To further investigate the cytotoxic mechanism, we evaluated the apoptotic characteristics of cells and mitochondrial integrity. The compound was treated with cell pellets for 24 hours and the degree of activation of apoptosis was measured with caspase 3/7 fluorescent dye. The staining results of caspase 3/7 on cell spheres (control cell spheres treated with methylmercury) are shown in Figure 2B. Treatment of the cell sphere with the compound induces apoptosis, resulting in increased caspase 3/7 fluorescence intensity and an increase in the number of caspase 3/7 positive cells (apoptotic cells). The MitoTracker Orange fluorescent dye staining results were used to reflect changes in mitochondrial membrane potential. Treatment of cell spheres with compounds disrupts the integrity of the mitochondrial structure, which in turn leads to a decrease in the fluorescence intensity of MitoTracker Orange (concentration-dependent properties, Figure 2C)
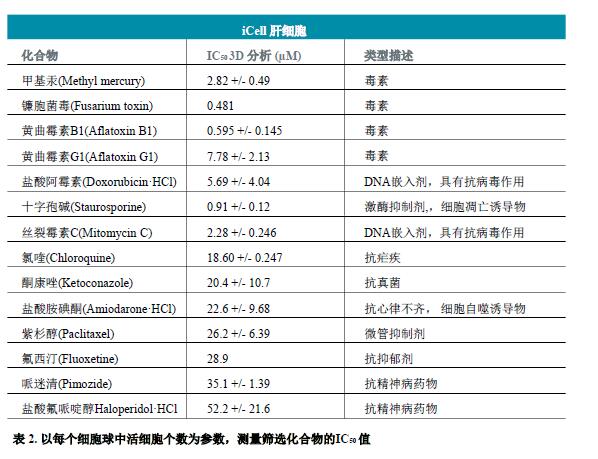
Measurements of parameters such as viable cell count, calcein AM fluorescence intensity, and calceinAM positive cell content found that these parameters were perfectly consistent with the four-parameter dose response curve model (Fig. 4B). IC50 values ​​(Table 2) were generated by SoftMax® Pro 6 software (MolecularDevices).
to sum up:
In the process of evaluating hepatotoxicity, 3D liver ball model + high content 3D analysis mode as a sensitive and reproducible method has more and more broad application prospects. The prediction accuracy of this method still needs to be improved compared to animal experiments and clinical data. Further development of the related model, further optimization of the detection method is conducive to expanding the application space of the method in the field of in vitro screening.
references:
Chang, TT, & Hughes-Fulford, M. (2009). Monolayer and Spheroid Culture of Human Liver Hepatocellular Carcinoma Cell Line Cells Demonstrate Distinct Global Gene Expression Patterns and Functional Phenotypes. Tissue Engineering Part A, 15(3), 559-567 .
Hartung, T. (2009). Toxicology for the twentyfirst century. Nature, 460(7252), 208-212.
Kunz-Schughart, LA (2004). The Use of 3-D Cultures for High-Throughput Screening: The Multicellular Spheroid Model. Journal of Biomolecular Screening, 9(4), 273-285.
Lu, J., Einhorn, S., Venkatarangan, L., Miller, M., Mann, DA, Watkins, PB, & Lecluyse, E. (2015). Morphological and Functional Characterization and Assessment of iPSCDerived Hepatocytes for In Vitro Toxicity Testing. Toxicological Sciences, 147(1), 39-54.
One-stop solution, one machine multi-test
The test time is 3 to 15 minutes, and the results are quickly released
Easy-to-use touch screen platform, multilingual operating system
Reagents are stored at room temperature for 24 months without cold chain transportation.
High sensitivity and specificity.
Maintenance-free.
Pet Test Kit,Dna acquisition test swab kit,It is used by veterinarians to quickly diagnose diseases in dogs and cats,High-precision pet colloidal gold detection kit
Jiangsu iiLO Biotechnology Co., Ltd. , https://www.iilogene.com